theme_dfe_light
themes.Rdtheme_dfe_light
DfE Plot Themes
theme_dfe_light()

theme_nimbus(
  base_size = 11,
  base_family = "",
  base_line_size = base_size/22,
  base_rect_size = base_size/22,
  all_gridlines = FALSE
)
Arguments
- base_size, base_family, base_line_size, base_rect_size
See
ggplot2::theme_grey()for details- all_gridlines
Set
TRUEto show all panel gridlines - by default, the vertical gridlines will not be shown.
Value
A light ggplot2 DfE theme
A ggplot2 plot theme
Examples
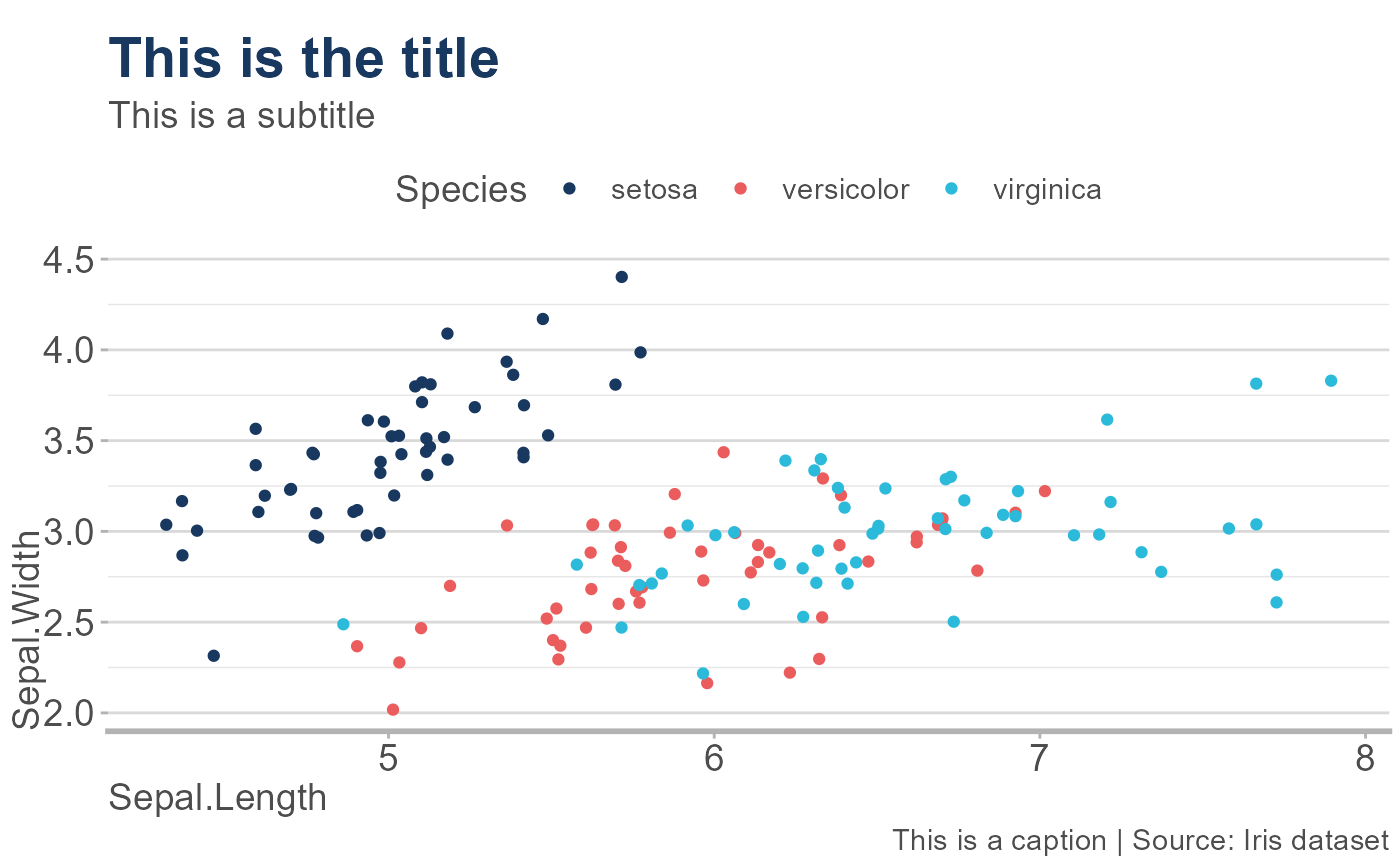
library(ggplot2)
plot <- ggplot(data = iris, aes(x = Sepal.Length, y = Sepal.Width, colour = Species))+
geom_jitter()+
scale_colour_dfe()+
labs(title = "This is the title",
subtitle = "This is a subtitle",
caption = "This is a caption | Source: Iris dataset")
plot + theme_dfe_light()
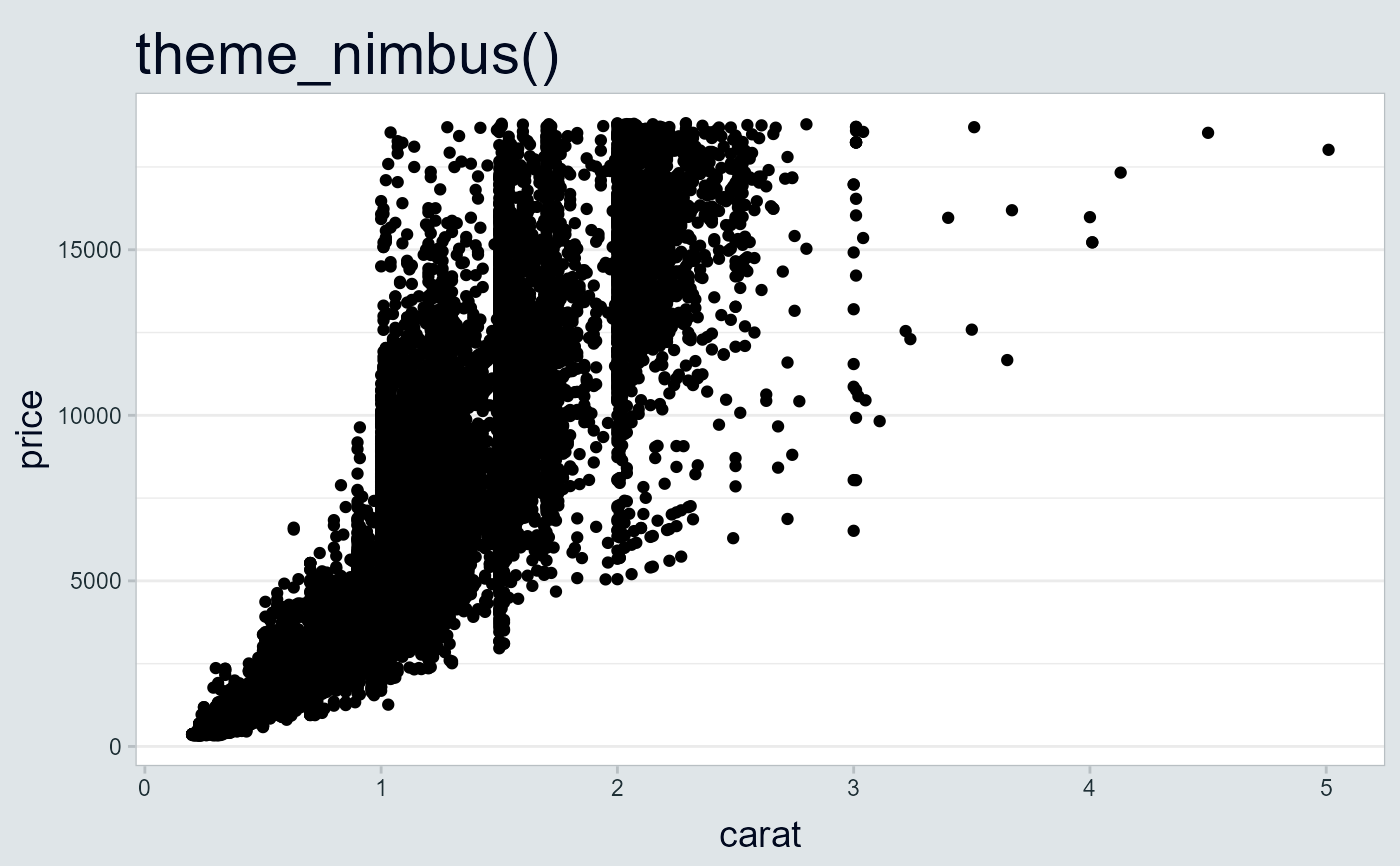
 library(ggplot2)
p1 <- ggplot(diamonds, aes(carat, price)) + geom_point()
p2 <- p1 + facet_wrap(~cut)
p1 + theme_nimbus() + ggtitle("theme_nimbus()")
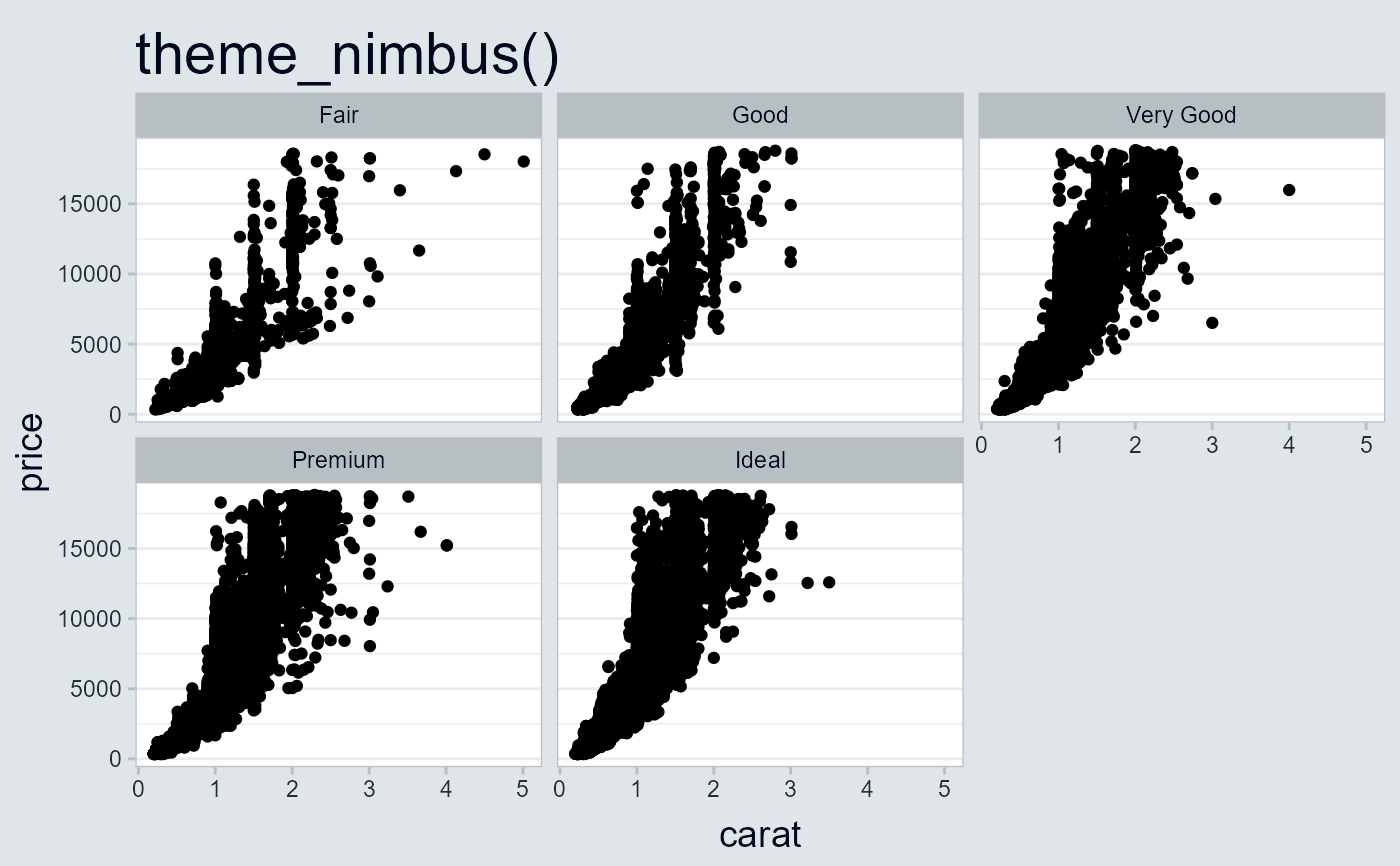
library(ggplot2)
p1 <- ggplot(diamonds, aes(carat, price)) + geom_point()
p2 <- p1 + facet_wrap(~cut)
p1 + theme_nimbus() + ggtitle("theme_nimbus()")
 p2 + theme_nimbus() + ggtitle("theme_nimbus()")